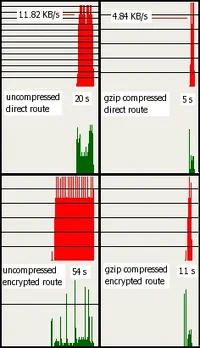
Here's a possibly interesting little bit of data I gathered to show the effects of having the server send compressed HTML pages to "browsers" which can use it that way. This difference (as shown between the two bottom graphs in the attached image) should be noticeable to everyone, even on a broadband connection.
I use a little window in the corner of my screen which performs the function of a strip chart tracking my incoming and outgoing data traffic/rates over the interface to the Internet (modem in this case). The outgoing data is on the bottom in green, and the incoming is on the top in red.
The chart initially indicates 0 - 1 KB/s data rate in the vertical scale, but dynamically scales as needed. Whenever any 1 KB/s increment is exceeded, it draws a horizontal line and adds another 1 KB/s. You'll see what I'm talking about in the attached image.
Each individual vertical line is a 1 second interval. The window was randomly sized, but as it so happens, it represent 118 seconds of traffic.
The attached image is a composite of four times fetching this very thread late last night while the traffic and page were both stable. The document fetched was the entire thread on one page, and it only includes the HTML data itself, none of the images.
The page at the time was 222060 bytes in size.
One thing that will be shown is that when dealing with plain text, my modem and the one at the ISP do a moderately fair job compressing/uncompressing the data for transmission. I'm unsure, but don't believe that cable modems do that. At any rate, the raw throughput over the phone line for my (nominal) 56k dialup connection is about 4.8 KB/s. Since the plain text was compressed by the the ISP modem and uncompressed by mine, the effective transfer rate was 11.8 KB/s.
The transfer rates included on the two upper graphs is that as reported by the program which fetched the page. The spikes above that rate in the charts indicate the overhead required for the transfer mechanism (the data packets are encapsulated).
The number of seconds as recorded in the graphs is the whole number reported. I'm sure there was some rounding involved.
I could not pull the data transfer rates from the fetching program for the two lower charts because it falsely claims 5.6 MB/s since it is receiving all the data in one quick chunk from the proxy stuff I'm using. But you can see that it matches the upper right in terms of throughput.
One other thing, at the risk of being tediously tedious: compressed data, such as (GIF, PNG, JPEG) images cannot be compressed/uncompressed by the modems. This includes the data as I usually get it, encrypted (which does not compress well due to randomness) via the outward-facing proxy I use, freely available from
http://tor.eff.org/ (check it out!). I understand from friends with high-speed connections that tor can drastically decrease their connectivity throughput, but I notice only the increased latency due to bouncing to three places around the globe.
Browsing this site using tor was a performance hit for me. However, as you'll note in the charts, Colin having switched on the compressed output has brought it back to usability.
You should all have noticed this too, if you're using a modern browser which accepts compressed text.
Enjoy.
Glen

")