Amount of Leverage at Lean

TheTreeSpyder

Branched out member
Location
Florida>>> USA
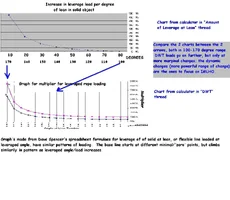
i have a spreadsheet that Dave Spencer helped me put together; that shows the leverage incurred by the same tree at different angles of lean. From your inputs of weight and length; it calculates the potential leverage, then the leverage incurred from straight vertical to straight horizontal in 10 degree increments; into a 5 x 10 chart automatically. The chart also shows the increase in leverage from the previous lean calculation, then that as a % of change compared to leverage load at that angle, % of change per maximum total leverage, and % of leverage achieved per maximum leverage total leverage too. With his small chart before you, some patterns become evident.

As with Dave's previous spreadsheet, it isn't an attatchment type that is recognized by the board (.xls, you need Excel to use it too). So, to get a copy (or an expanded copy from what i originally sent out for people to check over); please feel free to email me.

These numbers, this physics rules things around us; especially in the raw forces we address in trees. Good things and bad things happen; because this physics never makes a mistake, never takes a vacation. i have been asking engineers, tree people etc. the answers that this table supplies for well over a year; and just happened to ask the right person, whom in a lil'more than an hour relieved my search!

Thanx again Dave!
 

Attachments

i have posted an attatchment that is the SpreadSheet calculator, but changed the .xls extension to .txt; you have to reset the .txt extension to .xls, then run in Excel. It worked here for me following that process, but i can email anyone that the lil'work around doesn't flow easily for.

On a 40' spar with a 5000# head, you could round and cheat, disallow the wieght of the trunk itself and say that there is a potential leverage of Length x Weight or 200,000ft.lbs. of leverage. But how much of that leverage that is incurred on the tree roots, hinge whatever depend on how much leaning that leveraged length is doing at the time. Like it is easier to hold a 15# weight at 1o'clock than at 3 o'clock angle.

One of the things the table shows, is that 50% of the potential leverage is incurred in the first 33% of being off balanced (from vertical)@ 1o'clock.

i think this can be a realistic root for other understandings and viewing of patterns of load force and the support required. Once the user input of height and weight are put in the calculator fills the rest of the table, showing increasing load from lean in 10 degree increments, and then the increase in load for that last movment, also setting each increment of 10 degree movement as ratios to other elements in the table to show respective patterns of loading- where the steep angle is in the graph etc.

This angle of lean is present in any tree with lean, or tree felling etc.; thereby the varying pulls on the trunk/roots/hinge. Varied even more by taking any FaceCut at all, for angle grows less (moving towards horizontal as 0); as yo make deeper and deeper FaceCut on same tree. Calculating C.o.B. as Weight at a certain angle from pivot of front part of hinge towards lean. To keep this leveraged load of lean in place the hinge must pull equally hard on the other side of that pivot(in front part of hinge). So this gives both numbers. The point the hinge folds, sets the strength of the hinge, per this loaded pull on it; yet goes through an arch of increasing leveraged pull on the set hinge strength at lower pressure(kinda). etc. etc. Many things shown..


Excel will output the results in html; so even if you don't have Excel, i or anyone else should be able to give you a sample sheet output emailed in .html (internet file tyoe that every Windows etc. computer can read); but of course you couldn't change the input values and then have the SpreadSheet do the array of calculations to produce the table.

Or you might try to download the FreeWare EasyOffice @ DownLoad.Com ; for a full set of MSOffice mirrored tools, including an Excel repelacement(that the sheet will run in , do these calcualtions for you with the right extension changed from .txt to .xls from my original post above); EasyOffice is a lenghty file to downloadbut the price is right, and the programs very powerfull(dayminder, even reads documents aloud, dictionary etc. etc.)!
 
A while back, Wulke spoke of how it was beleieved that a limb at high leverage of pull (near horizontal) was weaker/ more prone to failure (especially in tight V?); yet he saw a different pattern. He, said how limbs growing vertically balanced when suddenly loaded seemed more prone to failure. i think because the growth could not be maximized in a determinated direction of loading. The chart bears out that something growing balaanced vertically or nearly so, is subjected to the most immediate increase in loading, for the very fewest degrees of movement; baring him out right very strongly on his observation. And as many things in nature, working dually, with non maximizable growth to every direction of pull, and be subject to this intense change in loading more than any other degree of lean!

i've changed the worksheet to read 0degress at vertical / 12 o'clock(the way we usually speak of things) rather than as originally taking that as 90 degrees. Added a hinge section, that shows if a tree starts falling on it's own at from X lean it will force a hinge of Y strength(~equal to the loading at that lean); then that hinge's load will increase Z% at horizontal. ......If it can hang on that long, from the loading. So trees with a slight lean should get a deeper FaceCut (to give more of an angle -'lean' between the pivot of the hinge and the tree); in this way you can most dramatically effect the numbers in your advantage.

These leverage of pulls numbers, work with the axis of the hinge's fall, and those OffSide pulls across the hinge pon that axis as well. Showing that even a little off balance to the side, can make intense leveraged differance to the direction of the tree.

The pattern of loading is in the degrees, the percentages on the chart are calculated everytime to whatever height and weight you choose, but remain the same. Except if you fiddle with the degrees of lean..
 

Attachments

The DWT thread shows how leveraged loads multiply in lines with more obtuse angles, the highest immediate change in loading at positions just off vertical. This is flexible line in 2/1 position/pattern.

The change in leverage just off verticalfollows a similar pattern of increased leverage loading.

So just as the one lesson in DWT, can teach speedline loads, power of sweating in etc.; some of that understanding can bleed to here and command even more with no more effort than realizing they are similar.

i did flip the degrees 180 on top chart to show the alignment, but i think that is a matter of perspective more than pattern; where zero is.
 

Attachments

  • 7800-Graph Comparison DWT to lean Load Increases.webp
    7800-Graph Comparison DWT to lean Load Increases.webp
    93.8 KB · Views: 73

New threads New posts

Back
Top Bottom